Market Outlook
March 06, 2017
Market Cues
Domestic Indices
Chg (%)
(Pts)
(Close)
Indian markets are likely to open flat tracking subdued overseas market and SGX
BSE Sensex
(0.0)
(7)
28,832
Nifty.
Nifty
(0.0)
(2)
8,898
US markets remained lackluster on Friday after Federal Reserve Chairperson Janet
Mid Cap
0.2
31
13,409
Yellen signaled on Friday that the Fed will likely resume raising interest rates later
Small Cap
0.3
46
13,620
this month to reflect a strengthening job market and inflation coming at central
bank’s target. European market closed on a mixed note ahead of the US Fed’s
Bankex
(0.3)
(62)
23,376
chairman Yellen’s comments.
Indian markets continued their upward rally last week. A better than expected GDP
Global Indices
Chg (%)
(Pts)
(Close)
data helped in markets rallying further. However, we believe the Indian markets
Dow Jones
0.0
3
21,006
might take a pause before seeing further upside in the near term. Market
Nasdaq
0.2
10
5,871
participants will also keenly watch out for exit poll results due for this week and
FTSE
(0.1)
(8)
7,374
could react accordingly.
Nikkei
(0.5)
(96)
19,469
News Analysis
Hang Seng
(0.7)
(175)
23,553
Nassscom sees FY18 industry growth at 8-10%
Shanghai Com
(0.4)
(12)
3,218
Alembic Pharmaceutical launches Desvenlafaxine in US
Detailed analysis on Pg2
Advances / Declines
BSE
NSE
Advances
1,361
739
Investor’s Ready Reckoner
Declines
1,496
914
Key Domestic & Global Indicators
Unchanged
166
75
Stock Watch: Latest investment recommendations on 150+ stocks
Refer Pg6 onwards
Volumes (` Cr)
Top Picks
BSE
3,002
CMP
Target
Upside
Company
Sector
Rating
NSE
21,983
(`)
(`)
(%)
Amara Raja Batteries Auto & Auto Ancillary
Buy
848
1,009
19.0
HCL Tech
IT
Buy
853
1,000
17.3
Net Inflows (` Cr)
Net
Mtd
Ytd
Power Grid Corp.
Power
Buy
191
223
16.8
FII
24
(73)
10,366
Navkar Corp.
Others
Buy
162
265
63.5
MFs
(169)
72
7,142
KEI Industries
Others
Buy
173
207
19.7
More Top Picks on Pg4
Top Gainers
Price (`)
Chg (%)
Escorts
488
6.4
Key Upcoming Events
Previous
Consensus
Infratel
308
6.4
Date
Region
Event Description
Reading
Expectations
Hindalco
199
4.8
Mar 07 Euro Zone Euro-Zone GDP s.a. (QoQ)
0.40
0.40
Balramchin
153
4.5
Mar 08 China
Exports YoY%
7.90
14.00
Mar 09 China
Consumer Price Index (YoY)
2.50
1.80
Hathway
37
4.2
Mar 09 US
Initial Jobless claims
223.00
238.00
Mar 09 Euro Zone ECB announces interest rates
0.00
0.00
Top Losers
Price (`)
Chg (%)
More Events on Pg5
Apollohosp
1,246
(5.3)
Bajajfinsv
3,767
(3.1)
Jisljaleqs
90
(2.9)
Network18
36
(2.7)
Amtekauto
37
(2.5)
As on March 03, 2017
Market Outlook
March 06, 2017
News Analysis
Nassscom sees FY18 industry growth at 8-10%
Software Industry body NASSCOM has said it expects the Indian IT sector to grow
by 8-10% in FY18. However, it has said that a clear picture will emerge only over
the next two three months. The industry body had given the projection to media in
last year November and it believes between November 2016- and March 2017
nothing much has changed which can change the projections. Looking at the
multiple challenges and headwinds from, during November, 2016 NASSCOM had
revised down its FY17 revenue growth target to 8-10% from initial 10-12%.
However, over the last few months the Visa issue has been one of the key point of
discussion and the news of US halting premium H1B visa processing is likely to
further increase the trouble for Indian IT companies. According to NASSCOM the
suspension of premium H1-B visa processing will create some process delays for
the companies, but is not a significant impediment.
Alembic Pharmaceutical launches Desvenlafaxine in US
Breckenridge Pharmaceutical, Inc. and Alembic Pharmaceuticals Limited have
launched their ANDA desvenlafaxine succinate extended-release tablets 50mg and
100mg, a generic version of Pristiq® by Pfizer Inc. Breckenridge and Alembic filed
their Paragraph IV ANDA on the first-to-file date and expect to share 180-day
exclusivity with other ANDA first filers (expected to be around 5-6). Alembic
Pharmaceuticals Limited is the sponsor and manufacturer of the ANDA, which will
be marketed exclusively by Breckenridge. The Paragraph IV litigation with respect
to the ANDA has been settled on terms that are confidential. The settlement
includes a license effective prior to the expirations of the patents involved in the
litigation.
Desvenlafaxine is a prescription drug that is indicated for the treatment of major
depressive disorder. Desvenlafaxine is in a class of medications called selective
serotonin and norepinephrine reuptake inhibitors (SNRIs). Pristiq® generated
sales of US$883mn, based on December
2016 IMS Health sales data. The
product will be available in 50mg and 100mg tablets. Thus given the competition
we expect the company to gross around US$25mn and US$8mn, of net sales and
profit respectively, during the 6-month exclusivity. We upgrade the rating to
accumulate with a revised price of `689.
Economic and Political News
Finance Ministry gives in principle nod to ESOPs by PSU banks.
FDI in services sectors up 77.6% in April-Dec2016.
Few more drugs to come under price control, says National Pharmaceutical
Pricing Authority.
Amul Milk has hiked its price by `2 per liter for its products across Gujarat and
Maharsatra.
Govt has created a `17,500cr trust to fund implementation of DMIC’s Phase-I
Market Outlook
March 06, 2017
Corporate News
BSE hikes annual fees for listed firms for FY18
Indian Oil may take Odisha Govt to court on Paradip refinery tax soaps
withdrawal
Tata Steel may scrap merger plan with Thyssenkrupp
Cipla inks pact to divest animal health business in South Africa
SBI to charge for breaching monthly average balance
Market Outlook
March 06, 2017
Top Picks ★★★★★
Large Cap
Market Cap
CMP
Target
Upside
Company
Rationale
(` Cr)
(`)
(`)
(%)
To outpace battery industry growth due to better
Amara Raja Batteries
14,487
848
1,009
19.0
technological products leading to market share gains in both
the automotive OEM and replacement segments.
The stock is trading at attractive valuations and is factoring
HCL Tech
1,20,328
853
1,000
17.3
all the bad news.
Back on the growth trend, expect a long term growth of 14%
Infosys
2,36,849
1,031
1,249
21.1
to be a US$20bn in FY2020.
Strong order backlog and improvement in execution would
Larsen & Toubro
1,37,057
1,469
1,634
11.2
trigger the growth for the L&T
One of the largest pharma companies with strong
Lupin
66,431
1,471
1,809
23.0
international presence. It has a rich pipeline of ANDAs which
is also one of the largest among the generic companies.
Going forward, we expect the company to report strong
Power Grid Corporation
99,871
191
223
16.8
top-line CAGR of ~16% and bottom-line CAGR of ~19%
over FY16-18 on back of strong capitalization guidance
Source: Company, Angel Research
Mid Cap
Market Cap
CMP
Target
Upside
Company
Rationale
(` Cr)
(`)
(`)
(%)
We expect the company would report strong profitability
Asian Granito
841
280
351
25.5
owing to better product mix, higher B2C sales and
amalgamation synergy.
Among the top 4 players in the consumer durables segment.
Bajaj Electricals
2,611
258
295
14.4
Improved profitability backed by turn around in E&P segment.
Strong order book lends earnings visibility.
Favourable outlook for the AC industry to augur well for
Cooling products business which is out pacing the market
Blue Star
5,418
567
634
11.8
growth. EMPPAC division's profitability to improve once
operating environment turns around.
With a focus on the low and medium income (LMI) consumer
Dewan Housing Finance
10,155
324
350
7.9
segment, the company has increased its presence in tier-II &
III cities where the growth opportunity is immense.
Strong loan growth backed by diversified loan portfolio and
Equitas Holdings
5,873
174
235
35.0
adequate CAR. ROE & ROA likely to remain decent as risk of
dilution remains low. Attractive valuations considering growth.
Economic recovery to have favourable impact on advertising
& circulation revenue growth. Further, the acquisition of a
Jagran Prakashan
6,218
190
225
18.3
radio business (Radio City) would also boost the company's
revenue growth.
High order book execution in EPC segment, rising B2C sales
KEI Industries
1,346
173
207
19.7
and higher exports to boost the revenues and profitability
Speedier execution and speedier sales, strong revenue visibilty
Mahindra Lifespace
1,416
345
522
51.3
in short-to-long run, attractive valuations
Higher growth in domestic branded sales and healthy export
Mirza International
1,072
89
107
20.1
to boost the profitability.
Massive capacity expansion along with rail advantage at ICD
Navkar Corporation
2,311
162
265
63.5
as well CFS augurs well for the company
Market leadership in Hindi news genre and no. 2 viewership
ranking in English news genre, exit from the radio business,
TV Today Network
1,552
260
385
48.0
and anticipated growth in ad spends by corporates to benefit
the stock.
Source: Company, Angel Research
Market Outlook
March 06, 2017
Key Upcoming Events
Global economic events release calendar
Bloomberg Data
Date
Time
Country
Event Description
Unit
Period
Last Reported
Estimated
Mar 07, 2017
3:30 PM Euro Zone Euro-Zone GDP s.a. (QoQ)
% Change
4Q F
0.40
0.40
Mar 08, 2017
China
Exports YoY%
% Change
Feb
7.90
14.00
Mar 09, 2017
7:00 AM China
Consumer Price Index (YoY)
% Change
Feb
2.50
1.80
7:00 PM US
Initial Jobless claims
Thousands
Mar 4
223.00
238.00
6:15 PM Euro Zone ECB announces interest rates
%
Mar 9
0.00
0.00
Mar 10, 2017
3:00 PM UK
Industrial Production (YoY)
% Change
Jan
4.30
3.20
India
Imports YoY%
% Change
Feb
10.70
India
Exports YoY%
% Change
Feb
4.30
5:30 PM India
Industrial Production YoY
% Change
Jan
-0.40
7:00 PM US
Change in Nonfarm payrolls
Thousands
Feb
227.00
190.00
7:00 PM US
Unnemployment rate
%
Feb
4.80
4.70
Mar 14, 2017 12:00 PM India
Monthly Wholesale Prices YoY%
% Change
Feb
5.25
US
Producer Price Index (mom)
% Change
Feb
1.10
Mar 15, 2017
3:00 PM UK
Jobless claims change
% Change
Feb
-42.40
6:00 PM US
Consumer price index (mom)
% Change
Feb
0.60
0.00
11:30 PM US
FOMC rate decision
%
Mar 15
0.75
0.75
March 16, 2017 3:30 PM Euro Zone Euro-Zone CPI (YoY)
%
Feb F
2.00
6:00 PM US
Building permits
Thousands
Feb
1293.00
1250.00
6:00 PM US
Housing Starts
Thousands
Feb
1246.00
1253.00
5:30 PM UK
BOE Announces rates
% Ratio
Mar 16
0.25
Mar 17, 2017
6:45 PM US
Industrial Production
%
Feb
(0.25)
0.20
Mar 21, 2017
3:00 PM UK
CPI (YoY)
% Change
Feb
1.80
Mar 22, 2017
7:30 PM US
Existing home sales
Million
Feb
5.69
5.60
Mar 23, 2017
8:30 PM Euro Zone Euro-Zone Consumer Confidence
Value
Mar A
(6.20)
7:30 PM US
New home sales
Thousands
Feb
555.00
565.00
Source: Bloomberg, Angel Research
Market Outlook
March 06, 2017
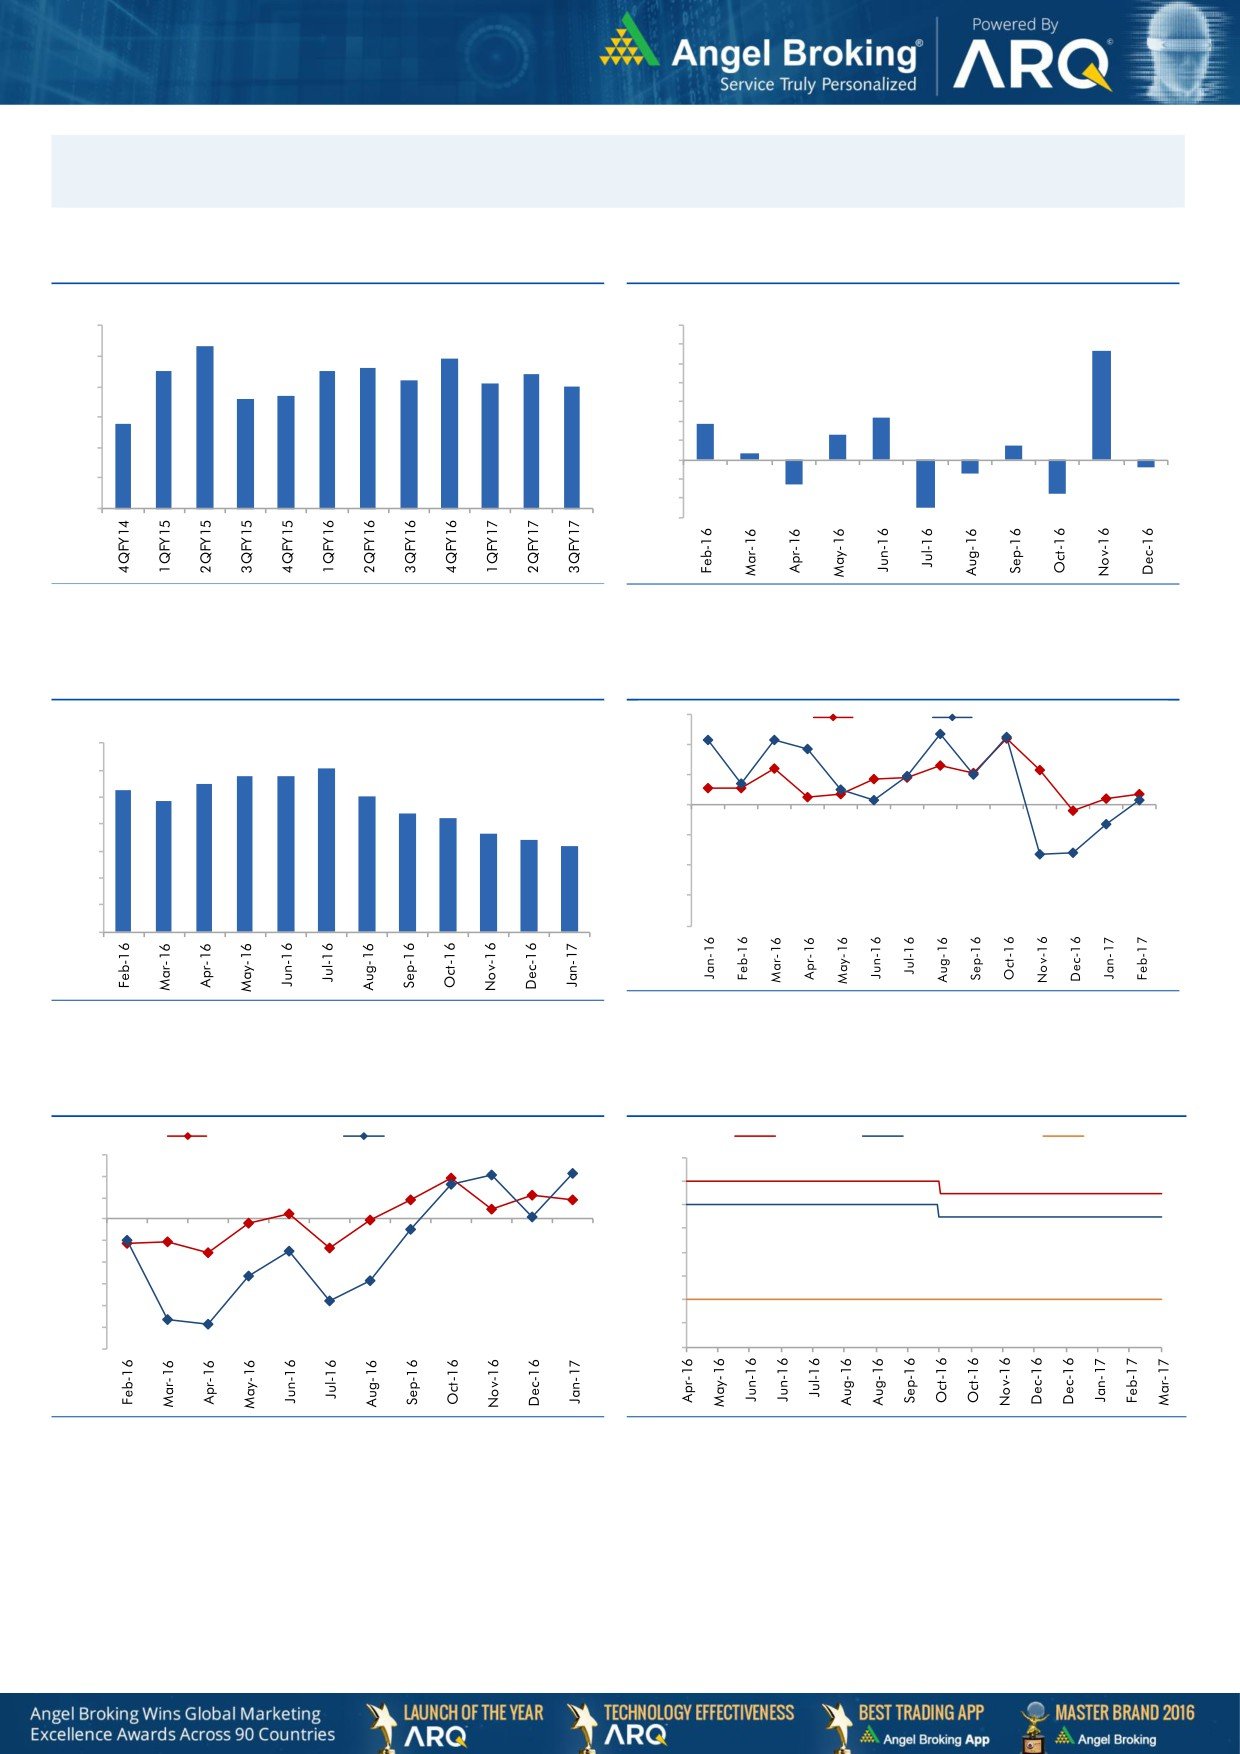
Macro watch
Exhibit 1: Quarterly GDP trends
Exhibit 2: IIP trends
(%)
(%)
9.0
8.3
7.0
5.7
7.9
6.0
8.0
7.5
7.5
7.6
7.4
7.2
5.0
7.1
7.0
6.6
6.7
4.0
7.0
3.0
2.2
5.8
1.9
6.0
2.0
1.3
0.7
1.0
0.3
5.0
-
4.0
(1.0)
(0.7)
(0.4)
(2.0)
3.0
(1.3)
(3.0)
(1.8)
(2.5)
Source: CSO, Angel Research
Source: MOSPI, Angel Research
Exhibit 3: Monthly CPI inflation trends
Exhibit 4: Manufacturing and services PMI
56.0
Mfg. PMI
Services PMI
(%)
7.0
54.0
6.1
5.8
5.8
6.0
5.3
5.5
5.1
52.0
4.8
5.0
4.4
4.2
50.0
3.6
4.0
3.4
3.2
48.0
3.0
46.0
2.0
44.0
1.0
42.0
-
Source: Market, Angel Research; Note: Level above 50 indicates expansion
Source: MOSPI, Angel Research
Exhibit 5: Exports and imports growth trends
Exhibit 6: Key policy rates
(%)
Exports yoy growth
Imports yoy growth
(%)
Repo rate
Reverse Repo rate
CRR
15.0
7.00
10.0
6.50
5.0
6.00
0.0
5.50
(5.0)
5.00
(10.0)
4.50
(15.0)
4.00
(20.0)
(25.0)
3.50
(30.0)
3.00
Source: Bloomberg, Angel Research
Source: RBI, Angel Research
Market Outlook
March 06, 2017
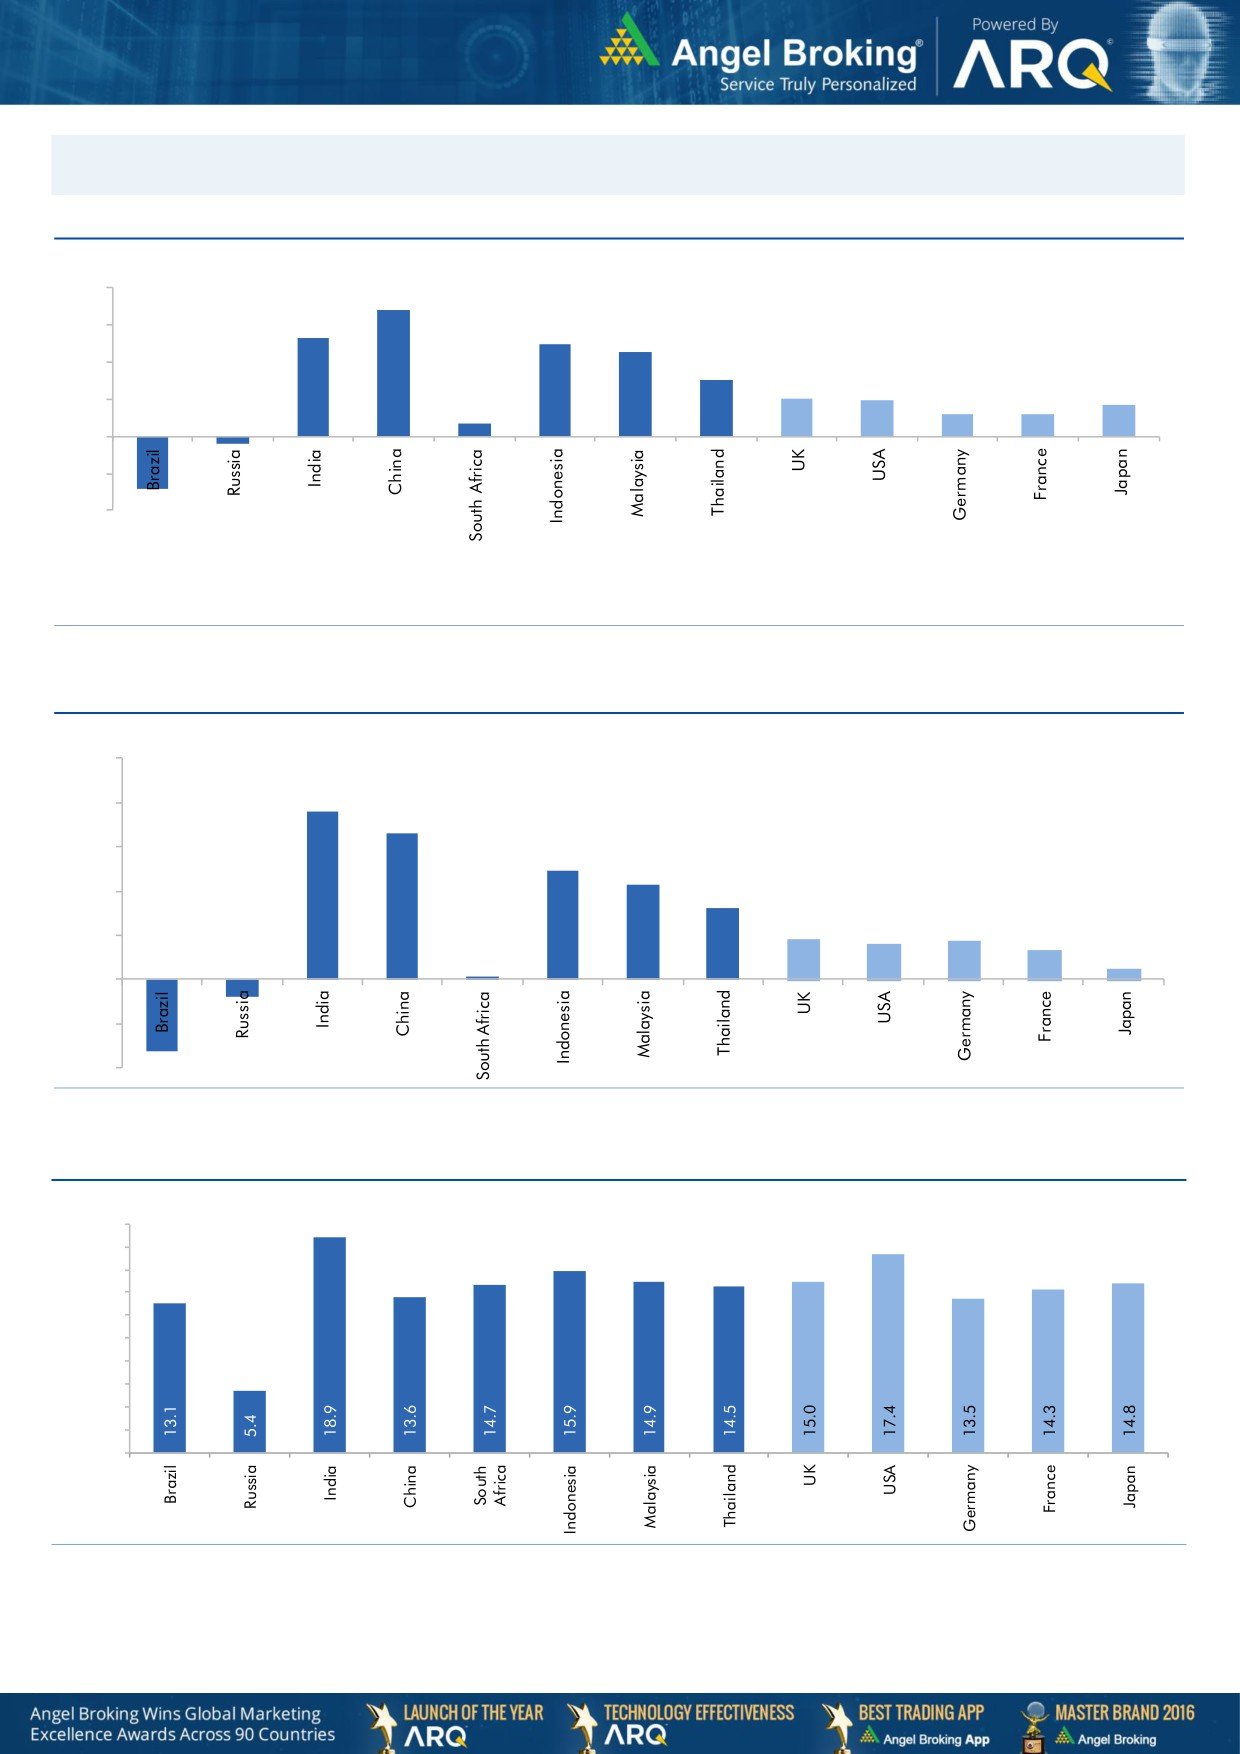
Global watch
Exhibit 1: Latest quarterly GDP Growth (%, yoy) across select developing and developed countries
(%)
8.0
6.8
0.7
5.3
6.0
4.9
4.5
4.0
3.0
2.0
1.9
1.2
1.2
1.7
2.0
-
(2.0)
(0.4)
(4.0)
(2.9)
Source: Bloomberg, Angel Research
Exhibit 2: 2016 GDP Growth projection by IMF (%, yoy) across select developing and developed countries
(%)
10.0
7.6
8.0
6.6
6.0
4.9
4.3
4.0
3.2
1.8
1.7
1.6
2.0
1.3
(0.8)
0.5
(3.3)
0.1
-
(2.0)
(4.0)
Source: IMF, Angel Research
Exhibit 3: One year forward P-E ratio across select developing and developed countries
(x)
20.0
18.0
16.0
14.0
12.0
10.0
8.0
6.0
4.0
2.0
-
Source: IMF, Angel Research
Market Outlook
March 06, 2017
Exhibit 4: Relative performance of indices across globe
Returns (%)
Country
Name of index
Closing price
1M
3M
1YR
Brazil
Bovespa
66,786
3.9
9.5
48.8
Russia
Micex
2,057
(7.2)
(3.1)
7.7
India
Nifty
8,898
3.9
8.6
27.6
China
Shanghai Composite
3,218
2.2
(1.3)
10.8
South Africa
Top 40
44,636
(3.4)
2.4
0.0
Mexico
Mexbol
47,415
0.9
5.6
5.4
Indonesia
LQ45
894
1.9
4.4
10.2
Malaysia
KLCI
1,708
1.3
5.0
2.7
Thailand
SET 50
983
(0.1)
5.2
16.5
USA
Dow Jones
21,006
5.7
9.9
23.5
UK
FTSE
7,374
3.8
8.7
19.3
Japan
Nikkei
19,469
1.7
6.3
22.3
Germany
DAX
12,027
3.2
14.4
26.6
France
CAC
4,995
4.2
10.3
10.8
Source: Bloomberg, Angel Research
Stock Watch
March 06, 2017
Company Name
Reco
CMP
Target
Mkt Cap
Sales ( Čcr )
OPM(%)
EPS (Č)
PER(x)
P/BV(x)
RoE(%)
EV/Sales(x)
(Č)
Price ( Č)
( Č cr )
FY17E FY18E
FY17E
FY18E
FY17E
FY18E
FY17E
FY18E
FY17E
FY18E
FY17E
FY18E
FY17E
FY18E
Agri / Agri Chemical
Rallis
Neutral
234
-
4,555
1,937
2,164
13.3
14.3
9.0
11.0
26.0
21.3
4.5
4.0
18.4
19.8
2.4
2.1
United Phosphorus
Neutral
691
-
35,018
15,176
17,604
18.5
18.5
37.4
44.6
18.5
15.5
3.6
3.0
21.4
21.2
2.4
2.0
Auto & Auto Ancillary
Ashok Leyland
Buy
87
111
24,845
20,021
21,915
11.6
11.9
4.5
5.3
19.4
16.4
4.0
3.5
20.6
21.5
1.2
1.1
Bajaj Auto
Neutral
2,831
-
81,923
25,093
27,891
19.5
19.2
143.9
162.5
19.7
17.4
5.5
4.7
30.3
29.4
3.0
2.6
Bharat Forge
Neutral
1,044
-
24,301
7,726
8,713
20.5
21.2
35.3
42.7
29.6
24.5
5.5
4.9
18.9
20.1
3.2
2.8
Eicher Motors
Neutral
23,089
-
62,827
16,583
20,447
17.5
18.0
598.0
745.2
38.6
31.0
13.2
10.1
41.2
38.3
3.6
2.9
Gabriel India
Buy
112
130
1,605
1,544
1,715
9.0
9.3
5.4
6.3
20.7
17.7
3.9
3.5
18.9
19.5
1.0
0.9
Hero Motocorp
Accumulate
3,271
3,446
65,312
28,083
30,096
15.3
15.7
171.8
187.0
19.0
17.5
6.6
5.6
30.1
27.9
2.2
2.0
Jamna Auto Industries Neutral
207
-
1,645
1,486
1,620
9.8
9.9
15.0
17.2
13.8
12.0
3.0
2.6
21.8
21.3
1.2
1.1
L G Balakrishnan & Bros Neutral
562
-
883
1,302
1,432
11.6
11.9
43.7
53.0
12.9
10.6
1.8
1.7
13.8
14.2
0.8
0.7
Mahindra and Mahindra Neutral
1,320
-
81,953
46,534
53,077
11.6
11.7
67.3
78.1
19.6
16.9
3.2
2.8
15.4
15.8
1.7
1.5
Maruti
Accumulate
5,892
6,560
177,980
67,822
83,288
16.0
16.4
253.8
312.4
23.2
18.9
5.3
4.3
23.0
22.9
2.3
1.8
Minda Industries
Neutral
430
-
3,414
2,728
3,042
9.0
9.1
68.2
86.2
6.3
5.0
1.4
1.1
23.8
24.3
1.3
1.1
Motherson Sumi
Neutral
354
-
49,708
45,896
53,687
7.8
8.3
13.0
16.1
27.2
22.0
8.8
7.0
34.7
35.4
1.2
1.0
Rane Brake Lining
Neutral
949
-
751
511
562
11.3
11.5
28.1
30.9
33.8
30.7
5.2
4.7
15.3
15.0
1.6
1.5
Setco Automotive
Neutral
35
-
472
741
837
13.0
13.0
15.2
17.0
2.3
2.1
0.4
0.4
15.8
16.3
1.0
0.9
Tata Motors
Neutral
460
-
132,847
300,209
338,549
8.9
8.4
42.7
54.3
10.8
8.5
1.7
1.5
15.6
17.2
0.6
0.5
TVS Motor
Neutral
429
-
20,398
13,390
15,948
6.9
7.1
12.8
16.5
33.7
26.0
8.4
6.6
26.3
27.2
1.6
1.3
Amara Raja Batteries
Buy
848
1,009
14,487
5,305
6,100
16.0
16.3
28.4
34.0
29.9
25.0
5.8
4.8
19.3
19.3
2.7
2.4
Exide Industries
Neutral
211
-
17,927
7,439
8,307
15.0
15.0
8.1
9.3
26.0
22.7
3.6
3.3
14.3
16.7
2.0
1.8
Apollo Tyres
Buy
183
235
9,320
12,877
14,504
14.3
13.9
21.4
23.0
8.5
8.0
1.3
1.2
16.4
15.2
0.9
0.8
Ceat
Buy
1,166
1,450
4,714
7,524
8,624
13.0
12.7
131.1
144.3
8.9
8.1
1.6
1.4
19.8
18.6
0.7
0.6
JK Tyres
Neutral
123
-
2,785
7,455
8,056
15.0
15.0
21.8
24.5
5.6
5.0
1.2
1.0
22.8
21.3
0.5
0.4
Swaraj Engines
Neutral
1,389
-
1,725
660
810
15.2
16.4
54.5
72.8
25.5
19.1
7.9
7.2
31.5
39.2
2.4
2.0
Subros
Neutral
196
-
1,173
1,488
1,681
11.7
11.9
6.4
7.2
30.6
27.3
3.2
2.9
10.8
11.4
1.0
0.9
Indag Rubber
Neutral
194
-
510
286
326
19.8
16.8
11.7
13.3
16.6
14.6
2.8
2.6
17.8
17.1
1.5
1.3
Capital Goods
ACE
Neutral
54
-
536
709
814
4.1
4.6
1.4
2.1
38.7
25.8
1.6
1.5
4.4
6.0
0.9
0.8
BEML
Neutral
1,301
-
5,416
3,451
4,055
6.3
9.2
31.4
57.9
41.4
22.5
2.5
2.3
6.3
10.9
1.7
1.4
Bharat Electronics
Neutral
1,495
-
33,388
8,137
9,169
16.8
17.2
58.7
62.5
25.5
23.9
3.9
3.5
44.6
46.3
3.1
2.8
Stock Watch
March 06, 2017
Company Name
Reco
CMP
Target
Mkt Cap
Sales ( Čcr )
OPM(%)
EPS (Č)
PER(x)
P/BV(x)
RoE(%)
EV/Sales(x)
(Č)
Price ( Č)
( Č cr )
FY17E
FY18E
FY17E
FY18E
FY17E
FY18E
FY17E
FY18E
FY17E
FY18E
FY17E
FY18E
FY17E
FY18E
Capital Goods
Voltas
Accumulate
372
407
12,306
6,511
7,514
7.9
8.7
12.9
16.3
28.8
22.8
5.2
4.6
16.7
18.5
1.6
1.4
BGR Energy
Neutral
131
-
947
16,567
33,848
6.0
5.6
7.8
5.9
16.8
22.3
1.0
0.9
4.7
4.2
0.2
0.1
BHEL
Neutral
158
-
38,709
28,797
34,742
-
2.8
2.3
6.9
68.8
22.9
1.2
1.1
1.3
4.8
1.0
0.7
Blue Star
Accumulate
567
634
5,418
4,283
5,077
5.9
7.3
14.9
22.1
38.1
25.6
7.4
6.2
20.4
26.4
1.3
1.1
Crompton Greaves
Neutral
68
-
4,237
5,777
6,120
5.9
7.0
3.3
4.5
20.5
15.0
0.9
0.9
4.4
5.9
0.7
0.6
Greaves Cotton
Neutral
157
-
3,830
1,755
1,881
16.8
16.9
7.8
8.5
20.1
18.5
4.0
3.7
20.6
20.9
1.9
1.7
Inox Wind
Neutral
168
-
3,725
5,605
6,267
15.7
16.4
24.8
30.0
6.8
5.6
1.9
1.4
25.9
24.4
0.7
0.6
KEC International
Neutral
167
-
4,293
9,294
10,186
7.9
8.1
9.9
11.9
16.9
14.0
2.5
2.2
15.6
16.3
0.7
0.6
KEI Industries
Buy
173
207
1,346
2,682
3,058
10.4
10.0
11.7
12.8
14.7
13.5
3.0
2.5
20.1
18.2
0.7
0.6
Thermax
Neutral
875
-
10,429
5,421
5,940
7.3
7.3
25.7
30.2
34.1
29.0
4.1
3.8
12.2
13.1
1.8
1.7
VATech Wabag
Buy
581
681
3,170
3,136
3,845
8.9
9.1
26.0
35.9
22.4
16.2
2.8
2.4
13.4
15.9
0.9
0.7
Cement
ACC
Neutral
1,395
-
26,194
11,225
13,172
13.2
16.9
44.5
75.5
31.3
18.5
3.0
2.7
11.2
14.2
2.3
2.0
Ambuja Cements
Neutral
226
-
44,786
9,350
10,979
18.2
22.5
5.8
9.5
38.9
23.7
3.3
2.9
10.2
12.5
4.8
4.1
India Cements
Neutral
166
-
5,087
4,364
4,997
18.5
19.2
7.9
11.3
21.0
14.7
1.5
1.5
8.0
8.5
1.9
1.7
JK Cement
Neutral
866
-
6,051
4,398
5,173
15.5
17.5
31.2
55.5
27.7
15.6
3.3
2.9
12.0
15.5
1.9
1.6
J K Lakshmi Cement
Neutral
405
-
4,760
2,913
3,412
14.5
19.5
7.5
22.5
53.9
18.0
3.3
2.8
12.5
18.0
2.2
1.9
Orient Cement
Neutral
143
-
2,939
2,114
2,558
18.5
20.5
8.1
11.3
17.7
12.7
2.6
2.2
9.0
14.0
2.0
1.6
UltraTech Cement
Neutral
3,802
-
104,348
25,768
30,385
21.0
23.5
111.0
160.0
34.3
23.8
4.4
3.8
13.5
15.8
4.1
3.5
Construction
ITNL
Neutral
100
-
3,291
8,946
10,017
31.0
31.6
8.1
9.1
12.4
11.0
0.5
0.5
4.2
5.0
3.7
3.4
KNR Constructions
Neutral
181
-
2,544
1,385
1,673
14.7
14.0
41.2
48.5
4.4
3.7
0.8
0.7
14.9
15.2
1.9
1.6
Larsen & Toubro
Accumulate
1,469
1,634
137,057
111,017
124,908
11.0
11.0
61.1
66.7
24.1
22.0
2.9
2.7
13.1
12.9
2.3
2.1
Gujarat Pipavav Port
Neutral
153
-
7,385
705
788
52.2
51.7
5.0
5.6
30.6
27.3
3.0
2.7
11.2
11.2
10.1
8.6
Nagarjuna Const.
Neutral
80
-
4,422
8,842
9,775
9.1
8.8
5.3
6.4
15.0
12.4
1.2
1.1
8.2
9.1
0.7
0.6
PNC Infratech
Buy
101
143
2,580
2,350
2,904
13.1
13.2
9.0
8.8
11.2
11.4
0.4
0.4
15.9
13.9
1.2
1.0
Simplex Infra
Neutral
297
-
1,469
6,829
7,954
10.5
10.5
31.4
37.4
9.5
7.9
1.0
0.9
9.9
13.4
0.6
0.5
Power Mech Projects
Neutral
426
-
627
1,801
2,219
12.7
14.6
72.1
113.9
5.9
3.7
1.1
0.9
16.8
11.9
0.4
0.3
Sadbhav Engineering
Accumulate
272
298
4,668
3,598
4,140
10.3
10.6
9.0
11.9
30.2
22.9
3.2
2.8
9.9
11.9
1.6
1.3
NBCC
Neutral
168
-
15,138
7,428
9,549
7.9
8.6
8.2
11.0
20.5
15.3
1.0
0.8
28.2
28.7
1.8
1.3
MEP Infra
Neutral
47
-
762
1,877
1,943
30.6
29.8
3.0
4.2
15.6
11.2
7.6
5.1
0.6
0.6
1.8
1.6
Stock Watch
March 06, 2017
Company Name
Reco
CMP
Target
Mkt Cap
Sales ( Čcr )
OPM(%)
EPS (Č)
PER(x)
P/BV(x)
RoE(%)
EV/Sales(x)
(Č)
Price ( Č)
( Č cr )
FY17E
FY18E
FY17E
FY18E
FY17E
FY18E
FY17E
FY18E
FY17E
FY18E
FY17E
FY18E
FY17E
FY18E
Construction
SIPL
Neutral
95
-
3,343
1,036
1,252
65.5
66.2
(8.4)
(5.6)
3.6
4.1
(22.8)
(15.9)
11.4
9.5
Engineers India
Neutral
148
-
9,987
1,725
1,935
16.0
19.1
11.4
13.9
13.0
10.7
1.8
1.7
13.4
15.3
4.7
4.2
Financials
Axis Bank
Accumulate
513
580
122,696
46,932
53,575
3.5
3.4
32.4
44.6
15.9
11.5
2.0
1.8
13.6
16.5
-
-
Bank of Baroda
Neutral
160
-
36,855
19,980
23,178
1.8
1.8
11.5
17.3
13.9
9.3
1.6
1.3
8.3
10.1
-
-
Canara Bank
Neutral
289
-
15,676
15,225
16,836
1.8
1.8
14.5
28.0
19.9
10.3
1.4
1.1
5.8
8.5
-
-
Can Fin Homes
Accumulate
1,954
2,128
5,202
420
526
3.5
3.5
86.5
107.8
22.6
18.1
4.9
4.0
23.6
24.1
-
-
Cholamandalam Inv. &
Buy
963
1,230
15,055
2,012
2,317
6.3
6.3
42.7
53.6
22.6
18.0
3.6
3.1
16.9
18.3
-
-
Fin. Co.
Dewan Housing Finance Accumulate
324
350
10,155
2,225
2,688
2.9
2.9
29.7
34.6
10.9
9.4
1.8
1.5
16.1
16.8
-
-
Equitas Holdings
Buy
174
235
5,873
939
1,281
11.7
11.5
5.8
8.2
30.0
21.2
2.6
2.3
10.9
11.5
-
-
Federal Bank
Neutral
85
-
14,688
8,259
8,995
3.0
3.0
4.3
5.6
19.8
15.2
1.7
1.6
8.5
10.1
-
-
HDFC
Neutral
1,371
-
217,487
11,475
13,450
3.4
3.4
45.3
52.5
30.3
26.1
5.8
5.2
20.2
20.5
-
-
HDFC Bank
Neutral
1,377
-
352,407
46,097
55,433
4.5
4.5
58.4
68.0
23.6
20.2
4.1
3.5
18.8
18.6
-
-
ICICI Bank
Accumulate
276
315
160,622
42,800
44,686
3.1
3.3
18.0
21.9
15.3
12.6
2.1
1.9
11.1
12.3
-
-
Lakshmi Vilas Bank
Accumulate
162
174
3,096
3,339
3,799
2.7
2.8
11.0
14.0
14.7
11.6
1.5
1.4
11.2
12.7
-
-
LIC Housing Finance
Accumulate
555
630
28,014
3,712
4,293
2.6
2.5
39.0
46.0
14.2
12.1
2.7
2.3
19.9
20.1
-
-
Punjab Natl.Bank
Neutral
140
-
29,717
23,532
23,595
2.3
2.4
6.8
12.6
20.5
11.1
3.2
2.3
3.3
6.5
-
-
RBL Bank
Neutral
456
-
16,847
1,783
2,309
2.6
2.6
12.7
16.4
35.9
27.8
3.9
3.5
12.8
13.3
-
-
Repco Home Finance
Buy
644
825
4,029
388
457
4.5
4.2
30.0
38.0
21.5
17.0
3.6
3.0
18.0
19.2
-
-
South Ind.Bank
Neutral
20
-
2,752
6,435
7,578
2.5
2.5
2.7
3.1
7.5
6.6
1.0
0.8
10.1
11.2
-
-
St Bk of India
Neutral
265
-
211,417
88,650
98,335
2.6
2.6
13.5
18.8
19.6
14.1
1.9
1.6
7.0
8.5
-
-
Union Bank
Neutral
144
-
9,927
13,450
14,925
2.3
2.3
25.5
34.5
5.7
4.2
0.8
0.7
7.5
10.2
-
-
Yes Bank
Neutral
1,435
-
60,767
8,978
11,281
3.3
3.4
74.0
90.0
19.4
16.0
3.7
3.1
17.0
17.2
-
-
FMCG
Akzo Nobel India
Accumulate
1,543
1,720
7,401
2,955
3,309
13.3
13.7
57.2
69.3
27.0
22.3
8.8
7.4
32.7
33.3
2.3
2.0
Asian Paints
Neutral
1,015
-
97,311
17,128
18,978
16.8
16.4
19.1
20.7
53.1
49.0
18.5
17.4
34.8
35.5
5.6
5.1
Britannia
Buy
3,095
3,626
37,143
9,594
11,011
14.6
14.9
80.3
94.0
38.6
32.9
15.9
12.2
41.2
-
3.7
3.2
Colgate
Accumulate
908
995
24,691
4,605
5,149
23.4
23.4
23.8
26.9
38.1
33.8
21.1
16.5
64.8
66.8
5.3
4.7
Dabur India
Accumulate
277
304
48,785
8,315
9,405
19.8
20.7
8.1
9.2
34.2
30.1
9.5
7.9
31.6
31.0
5.5
4.8
GlaxoSmith Con*
Neutral
5,195
-
21,846
4,350
4,823
21.2
21.4
179.2
196.5
29.0
26.4
7.7
6.5
27.1
26.8
4.4
3.9
Godrej Consumer
Neutral
1,603
-
54,605
10,235
11,428
18.4
18.6
41.1
44.2
39.0
36.3
8.7
7.3
24.9
24.8
5.4
4.8
Stock Watch
March 06, 2017
Company Name
Reco
CMP
Target
Mkt Cap
Sales ( Čcr )
OPM(%)
EPS (Č)
PER(x)
P/BV(x)
RoE(%)
EV/Sales(x)
(Č)
Price ( Č)
( Č cr )
FY17E FY18E
FY17E
FY18E
FY17E
FY18E
FY17E
FY18E
FY17E
FY18E
FY17E
FY18E
FY17E
FY18E
FMCG
HUL
Neutral
877
-
189,842
35,252
38,495
17.8
17.8
20.7
22.4
42.5
39.2
40.6
34.8
95.6
88.9
5.2
4.8
ITC
Accumulate
262
284
317,949
40,059
44,439
38.3
39.2
9.0
10.1
29.2
25.9
8.1
7.1
27.8
27.5
7.4
6.7
Marico
Accumulate
279
300
36,001
6,430
7,349
18.8
19.5
6.4
7.7
43.6
36.2
13.2
11.1
33.2
32.5
5.4
4.7
Nestle*
Neutral
6,175
-
59,532
10,073
11,807
20.7
21.5
124.8
154.2
49.5
40.0
20.3
18.3
34.8
36.7
5.7
4.9
Tata Global
Neutral
143
-
9,047
8,675
9,088
9.8
9.8
7.4
8.2
19.4
17.5
1.5
1.5
7.9
8.1
1.0
0.9
Procter & Gamble
Neutral
7,024
-
22,801
2,939
3,342
23.2
23.0
146.2
163.7
48.0
42.9
12.2
10.1
25.3
23.5
7.3
6.3
Hygiene
IT
HCL Tech^
Buy
853
1,000
120,328
49,242
57,168
20.5
20.5
55.7
64.1
15.3
13.3
3.1
2.4
20.3
17.9
2.3
1.9
Infosys
Buy
1,031
1,249
236,849
68,350
77,326
27.0
27.0
62.5
69.4
16.5
14.9
3.5
3.2
21.3
21.6
2.9
2.5
TCS
Accumulate
2,492
2,700
491,100
119,025
133,308
27.6
27.6
131.2
145.5
19.0
17.1
6.2
5.7
32.4
33.1
3.9
3.4
Tech Mahindra
Buy
504
600
49,061
29,673
32,937
15.5
17.0
32.8
39.9
15.4
12.6
3.0
2.6
19.6
20.7
1.4
1.2
Wipro
Buy
492
583
119,697
55,440
60,430
18.1
18.1
36.1
38.9
13.6
12.7
2.5
2.3
19.0
17.6
1.9
1.7
Media
D B Corp
Neutral
380
-
6,988
2,297
2,590
27.4
28.2
21.0
23.4
18.1
16.2
4.2
3.7
23.7
23.1
2.8
2.4
HT Media
Neutral
83
-
1,932
2,693
2,991
12.6
12.9
7.9
9.0
10.5
9.2
0.9
0.8
7.8
8.3
0.3
0.2
Jagran Prakashan
Buy
190
225
6,218
2,355
2,635
28.0
28.0
10.8
12.5
17.6
15.2
3.8
3.3
21.7
21.7
2.7
2.3
Sun TV Network
Neutral
726
-
28,607
2,850
3,265
70.1
71.0
26.2
30.4
27.7
23.9
7.1
6.3
24.3
25.6
9.6
8.3
Hindustan Media
Neutral
270
-
1,980
1,016
1,138
24.3
25.2
27.3
30.1
9.9
9.0
1.9
1.7
16.2
15.8
1.3
1.1
Ventures
TV Today Network
Buy
260
385
1,552
637
743
27.5
27.5
18.4
21.4
14.2
12.2
2.5
2.1
17.4
17.2
2.0
1.7
Metals & Mining
Coal India
Neutral
322
-
199,661
84,638
94,297
21.4
22.3
24.5
27.1
13.1
11.9
5.5
5.2
42.6
46.0
1.9
1.7
Hind. Zinc
Neutral
312
-
131,978
14,252
18,465
55.9
48.3
15.8
21.5
19.8
14.5
3.2
2.8
17.0
20.7
9.3
7.2
Hindalco
Neutral
199
-
41,049
107,899
112,095
7.4
8.2
9.2
13.0
21.6
15.3
1.0
1.0
4.8
6.6
0.9
0.8
JSW Steel
Neutral
184
-
44,441
53,201
58,779
16.1
16.2
130.6
153.7
1.4
1.2
0.2
0.2
14.0
14.4
1.6
1.4
NMDC
Neutral
146
-
46,256
6,643
7,284
44.4
47.7
7.1
7.7
20.6
19.0
1.8
1.7
8.8
9.2
4.7
4.3
SAIL
Neutral
62
-
25,689
47,528
53,738
(0.7)
2.1
(1.9)
2.6
23.9
0.7
0.7
(1.6)
3.9
1.4
1.3
Vedanta
Neutral
268
-
79,306
71,744
81,944
19.2
21.7
13.4
20.1
20.0
13.3
1.7
1.5
8.4
11.3
1.5
1.2
Tata Steel
Neutral
495
-
48,075
121,374
121,856
7.2
8.4
18.6
34.3
26.6
14.4
1.7
1.5
6.1
10.1
1.0
1.0
Oil & Gas
Cairn India
Neutral
293
-
55,048
9,127
10,632
4.3
20.6
8.8
11.7
33.4
25.1
1.1
1.0
3.3
4.2
7.5
6.3
GAIL
Neutral
520
-
66,005
56,220
65,198
9.3
10.1
27.1
33.3
19.2
15.6
1.8
1.6
9.3
10.7
1.4
1.2
ONGC
Neutral
193
-
247,682
137,222
152,563
15.0
21.8
19.5
24.1
9.9
8.0
0.9
0.8
8.5
10.1
2.1
1.9
Indian Oil Corp
Neutral
375
-
182,121
373,359
428,656
5.9
5.5
54.0
59.3
7.0
6.3
1.1
1.0
16.0
15.6
0.6
0.6
Stock Watch
March 06, 2017
Company Name
Reco
CMP
Target
Mkt Cap
Sales ( Čcr )
OPM(%)
EPS (Č)
PER(x)
P/BV(x)
RoE(%)
EV/Sales(x)
(Č)
Price ( Č)
( Č cr )
FY17E FY18E
FY17E
FY18E
FY17E
FY18E
FY17E
FY18E
FY17E
FY18E
FY17E
FY18E
FY17E
FY18E
Oil & Gas
Reliance Industries
Neutral
1,258
-
408,224
301,963
358,039
12.1
12.6
87.7
101.7
14.4
12.4
1.5
1.3
10.7
11.3
1.8
1.5
Pharmaceuticals
Alembic Pharma
Accumulate
603
689
11,360
3,483
4,244
20.2
21.4
24.3
33.6
24.8
17.9
5.7
4.5
25.5
25.3
3.2
2.5
Alkem Laboratories Ltd
Neutral
2,139
-
25,574
6,065
7,009
18.7
20.0
80.2
92.0
26.7
23.3
6.0
5.0
22.5
21.6
4.2
3.6
Aurobindo Pharma
Buy
675
877
39,476
15,720
18,078
23.7
23.7
41.4
47.3
16.3
14.3
4.2
3.3
29.6
26.1
2.7
2.4
Aventis*
Neutral
4,301
-
9,905
2,277
2,597
17.3
18.3
149.4
172.0
28.8
25.0
4.8
3.8
25.1
28.8
4.0
3.3
Cadila Healthcare
Neutral
431
-
44,108
10,429
12,318
17.7
21.6
13.1
19.2
32.9
22.4
6.9
5.5
22.8
27.1
4.3
3.5
Cipla
Sell
588
465
47,267
15,378
18,089
15.7
16.8
19.3
24.5
30.4
24.0
3.6
3.2
12.3
13.9
3.2
2.7
Dr Reddy's
Neutral
2,872
-
47,582
16,043
18,119
18.0
23.0
78.6
130.9
36.5
21.9
3.6
3.1
10.1
15.2
2.7
2.6
Dishman Pharma
Neutral
222
-
3,584
1,718
1,890
22.7
22.8
9.5
11.3
23.4
19.7
2.3
2.1
10.1
10.9
2.6
2.2
GSK Pharma*
Neutral
2,705
-
22,915
2,800
3,290
10.2
20.6
32.2
60.3
84.0
44.9
15.6
15.4
17.2
34.5
8.0
6.8
Indoco Remedies
Reduce
266
240
2,451
1,112
1,289
16.2
18.2
11.6
16.0
22.9
16.6
3.7
3.1
17.0
20.1
2.3
2.0
Ipca labs
Accumulate
550
613
6,938
3,258
3,747
12.8
15.3
12.1
19.2
45.5
28.6
2.8
2.6
6.4
9.5
2.3
2.0
Lupin
Buy
1,471
1,809
66,431
15,912
18,644
26.4
26.7
58.1
69.3
25.3
21.2
4.9
4.0
21.4
20.9
4.2
3.5
Sun Pharma
Buy
686
847
164,539
31,129
35,258
32.0
32.9
30.2
35.3
22.7
19.4
3.7
3.1
20.0
20.1
4.9
4.1
Power
Tata Power
Neutral
82
-
22,152
36,916
39,557
17.4
27.1
5.1
6.3
16.1
13.0
1.4
1.3
9.0
10.3
1.6
1.5
NTPC
Neutral
156
-
128,464
86,605
95,545
17.5
20.8
11.8
13.4
13.2
11.6
1.3
1.3
10.5
11.1
2.8
2.8
Power Grid
Buy
191
223
99,871
25,315
29,193
88.2
88.7
14.2
17.2
13.5
11.1
2.1
1.8
15.2
16.1
8.6
7.7
Real Estate
Prestige Estate
Buy
172
210
6,443
4,707
5,105
25.2
26.0
10.3
13.0
16.7
13.2
1.3
1.2
10.3
10.2
2.5
2.2
MLIFE
Buy
345
522
1,416
1,152
1,300
22.7
24.6
29.9
35.8
11.5
9.6
0.9
0.8
7.6
8.6
1.9
1.6
Telecom
Bharti Airtel
Neutral
356
-
142,148
105,086
114,808
34.5
34.7
12.2
16.4
29.2
21.7
2.0
1.8
6.8
8.4
2.3
2.0
Idea Cellular
Neutral
111
-
39,855
40,133
43,731
37.2
37.1
6.4
6.5
17.3
17.0
1.4
1.3
8.2
7.6
2.0
1.7
zOthers
Abbott India
Neutral
4,476
-
9,511
3,153
3,583
14.1
14.4
152.2
182.7
29.4
24.5
144.4
123.3
25.6
26.1
2.7
2.3
Asian Granito
Buy
280
351
841
1,060
1,169
12.2
12.5
12.7
15.9
22.1
17.6
2.1
1.9
9.5
10.7
1.1
1.0
Bajaj Electricals
Accumulate
258
295
2,611
4,801
5,351
5.7
6.2
10.4
13.7
24.8
18.9
3.1
2.7
12.4
14.5
0.5
0.5
Banco Products (India)
Neutral
201
-
1,436
1,353
1,471
12.3
12.4
14.5
16.3
13.9
12.3
19.1
17.2
14.5
14.6
1.0
107.4
Coffee Day Enterprises
Neutral
234
-
4,827
2,964
3,260
20.5
21.2
4.7
8.0
-
29.3
2.7
2.5
5.5
8.5
2.0
1.8
Ltd
Competent Automobiles Neutral
166
-
102
1,137
1,256
3.1
2.7
28.0
23.6
5.9
7.0
32.0
28.9
14.3
11.5
0.1
0.1
Elecon Engineering
Neutral
53
-
598
1,482
1,660
13.7
14.5
3.9
5.8
13.7
9.2
3.2
3.0
7.8
10.9
0.7
0.6
Finolex Cables
Neutral
439
-
6,708
2,883
3,115
12.0
12.1
14.2
18.6
30.9
23.6
16.4
14.4
15.8
14.6
2.0
1.8
Stock Watch
March 06, 2017
Company Name
Reco
CMP
Target
Mkt Cap
Sales ( Čcr )
OPM(%)
EPS (Č)
PER(x)
P/BV(x)
RoE(%)
EV/Sales(x)
(Č)
Price ( Č)
( Č cr )
FY17E
FY18E
FY17E
FY18E
FY17E
FY18E
FY17E
FY18E
FY17E
FY18E
FY17E
FY18E
FY17E
FY18E
zOthers
Garware Wall Ropes
Accumulate
672
710
1,469
863
928
15.1
15.2
36.4
39.4
18.5
17.0
3.3
2.9
17.5
15.9
1.6
1.5
Goodyear India*
Neutral
723
-
1,667
1,598
1,704
10.4
10.2
49.4
52.6
14.6
13.7
67.6
59.3
18.2
17.0
0.7
101.3
Hitachi
Neutral
1,456
-
3,959
2,081
2,433
8.8
8.9
33.4
39.9
43.6
36.5
35.2
29.3
22.1
21.4
1.9
1.6
HSIL
Neutral
324
-
2,340
2,384
2,515
15.8
16.3
15.3
19.4
21.2
16.7
21.0
18.1
7.8
9.3
1.2
1.1
Interglobe Aviation
Neutral
859
-
31,054
21,122
26,005
14.5
27.6
110.7
132.1
7.8
6.5
46.4
33.2
168.5
201.1
1.4
1.1
Jyothy Laboratories
Neutral
362
-
6,583
1,440
2,052
11.5
13.0
8.5
10.0
42.6
36.2
10.3
9.6
18.6
19.3
4.9
3.4
Kirloskar Engines India
Neutral
377
-
5,458
2,554
2,800
9.9
10.0
10.5
12.1
35.9
31.2
15.0
14.2
10.7
11.7
1.8
1.6
Ltd
Linc Pen & Plastics
Neutral
242
-
357
382
420
9.3
9.5
13.5
15.7
17.9
15.4
3.1
2.7
17.1
17.3
1.0
0.9
M M Forgings
Neutral
469
-
566
546
608
20.4
20.7
41.3
48.7
11.4
9.6
64.3
56.9
16.6
17.0
0.9
0.8
Manpasand Bever.
Neutral
737
-
4,217
836
1,087
19.6
19.4
16.9
23.8
43.6
31.0
5.2
4.6
12.0
14.8
4.8
3.6
Mirza International
Buy
89
107
1,072
1,024
1,148
18.0
18.0
6.9
8.0
12.9
11.1
2.2
1.8
16.6
16.3
1.2
1.1
MT Educare
Neutral
96
-
382
366
417
17.7
18.2
9.4
10.8
10.2
8.9
2.3
2.0
22.2
22.3
0.9
0.8
Narayana Hrudaya
Neutral
324
-
6,621
1,873
2,166
11.5
11.7
2.6
4.0
122.5
81.7
7.5
6.8
6.1
8.3
3.6
3.1
Navkar Corporation
Buy
162
265
2,311
369
561
42.9
42.3
7.2
11.5
22.4
14.1
1.7
1.5
7.4
10.5
7.3
4.8
Navneet Education
Neutral
144
-
3,369
1,062
1,147
24.0
24.0
6.1
6.6
23.7
21.8
4.9
4.3
20.6
19.8
3.3
3.0
Nilkamal
Neutral
1,967
-
2,936
1,995
2,165
10.7
10.4
69.8
80.6
28.2
24.4
112.4
97.7
16.6
16.5
1.5
1.3
Page Industries
Neutral
14,241
-
15,884
2,450
3,124
20.1
17.6
299.0
310.0
47.6
45.9
317.2
242.1
47.1
87.5
6.5
5.1
Parag Milk Foods
Neutral
225
-
1,896
1,919
2,231
9.3
9.6
9.5
12.9
23.9
17.4
3.7
3.1
15.5
17.5
1.1
1.0
Quick Heal
Neutral
244
-
1,712
408
495
27.3
27.0
7.7
8.8
31.5
27.8
2.9
2.9
9.3
10.6
3.3
2.8
Radico Khaitan
Accumulate
128
147
1,702
1,667
1,824
13.0
13.2
6.7
8.2
19.2
15.6
1.7
1.6
9.0
10.2
1.4
1.3
Relaxo Footwears
Neutral
439
-
5,277
2,085
2,469
9.2
8.2
7.6
8.0
58.1
55.3
22.5
19.2
17.9
18.8
2.6
2.2
S H Kelkar & Co.
Neutral
289
-
4,176
1,036
1,160
15.1
15.0
6.1
7.2
47.3
40.2
5.1
4.6
10.7
11.5
3.9
3.4
Siyaram Silk Mills
Neutral
1,693
-
1,587
1,652
1,857
11.6
11.7
92.4
110.1
18.3
15.4
2.7
2.3
14.7
15.2
1.2
1.0
Styrolution ABS India*
Neutral
612
-
1,076
1,440
1,537
9.2
9.0
40.6
42.6
15.1
14.4
38.5
35.0
12.3
11.6
0.7
0.6
Surya Roshni
Neutral
187
-
822
3,342
3,625
7.8
7.5
17.3
19.8
10.9
9.5
20.6
16.5
10.5
10.8
0.5
0.5
Team Lease Serv.
Neutral
870
-
1,488
3,229
4,001
1.5
1.8
22.8
32.8
38.2
26.5
4.1
3.6
10.7
13.4
0.4
0.3
The Byke Hospitality
Neutral
166
-
667
287
384
20.5
20.5
7.6
10.7
21.9
15.5
4.6
3.7
20.7
23.5
2.3
1.7
Transport Corporation of
Neutral
200
-
1,535
2,671
2,911
8.5
8.8
13.9
15.7
14.5
12.8
2.0
1.8
13.7
13.8
0.7
0.6
India
TVS Srichakra
Neutral
2,951
-
2,259
2,304
2,614
13.7
13.8
231.1
266.6
12.8
11.1
331.5
261.0
33.9
29.3
1.0
0.8
Stock Watch
March 06, 2017
Company Name
Reco
CMP
Target Mkt Cap
Sales ( Čcr )
OPM(%)
EPS (Č)
PER(x)
P/BV(x)
RoE(%)
EV/Sales(x)
(Č)
Price ( Č)
( Č cr )
FY17E FY18E FY17E FY18E FY17E FY18E FY17E FY18E FY17E FY18E FY17E FY18E FY17E FY18E
zOthers
UFO Moviez
Neutral
398
-
1,098
619
685
33.2
33.4
30.0
34.9
13.3
11.4
1.8
1.6
13.8
13.9
1.5
1.2
Visaka Industries
Neutral
237
-
377
1,051
1,138
10.3
10.4
21.0
23.1
11.3
10.2
30.4
28.5
9.0
9.2
0.6
0.6
VRL Logistics
Neutral
289
-
2,639
1,902
2,119
16.7
16.6
14.6
16.8
19.9
17.2
4.4
3.8
21.9
22.2
1.5
1.3
Wonderla Holidays
Neutral
378
-
2,137
287
355
38.0
40.0
11.3
14.2
33.5
26.6
4.8
4.2
21.4
23.9
7.1
5.8
Source: Company, Angel Research; Note: *December year end; #September year end; &October year end; Price as on March 03, 2017
Market Outlook
March 06, 2017
Research Team Tel: 022 - 39357800
DISCLAIMER
Angel Broking Private Limited (hereinafter referred to as “Angel”) is a registered Member of National Stock Exchange of India
Limited,Bombay Stock Exchange Limited and Metropolitan Stock Exchange Limited. It is also registered as a Depository Participant with
CDSL and Portfolio Manager with SEBI. It also has registration with AMFI as a Mutual Fund Distributor. Angel Broking Private Limited is a
registered entity with SEBI for Research Analyst in terms of SEBI (Research Analyst) Regulations, 2014 vide registration number
INH000000164. Angel or its associates has not been debarred/ suspended by SEBI or any other regulatory authority for accessing
/dealing in securities Market. Angel or its associates/analyst has not received any compensation / managed or
co-managed public offering of securities of the company covered by Analyst during the past twelve months.
This document is solely for the personal information of the recipient, and must not be singularly used as the basis of any investment
decision. Nothing in this document should be construed as investment or financial advice. Each recipient of this document should make
such investigations as they deem necessary to arrive at an independent evaluation of an investment in the securities of the companies
referred to in this document (including the merits and risks involved), and should consult their own advisors to determine the merits and
risks of such an investment.
Reports based on technical and derivative analysis center on studying charts of a stock's price movement, outstanding positions and
trading volume, as opposed to focusing on a company's fundamentals and, as such, may not match with a report on a company's
fundamentals. Investors are advised to refer the Fundamental and Technical Research Reports available on our website to evaluate the
contrary view, if any.
The information in this document has been printed on the basis of publicly available information, internal data and other reliable
sources believed to be true, but we do not represent that it is accurate or complete and it should not be relied on as such, as this
document is for general guidance only. Angel Broking Pvt. Limited or any of its affiliates/ group companies shall not be in any way
responsible for any loss or damage that may arise to any person from any inadvertent error in the information contained in this report.
Angel Broking Pvt. Limited has not independently verified all the information contained within this document. Accordingly, we cannot
testify, nor make any representation or warranty, express or implied, to the accuracy, contents or data contained within this document.
While Angel Broking Pvt. Limited endeavors to update on a reasonable basis the information discussed in this material, there may be
regulatory, compliance, or other reasons that prevent us from doing so.
This document is being supplied to you solely for your information, and its contents, information or data may not be reproduced,
redistributed or passed on, directly or indirectly.
Neither Angel Broking Pvt. Limited, nor its directors, employees or affiliates shall be liable for any loss or damage that may arise from
or in connection with the use of this information.